Unit 6 — Thermodynamics: Free Energy, Phase Diagrams, Solidification and Segregation
Big idea. Materials settle into whichever phase has the lowest Gibbs free energy. Phase diagrams map those choices against temperature and composition. When a melt freezes, most impurities prefer to stay in the liquid — the segregation coefficient \(k < 1\) — so crystal growth purifies silicon, while also making dopant levels vary from one end of an ingot to the other (the Scheil equation).
Learning objectives
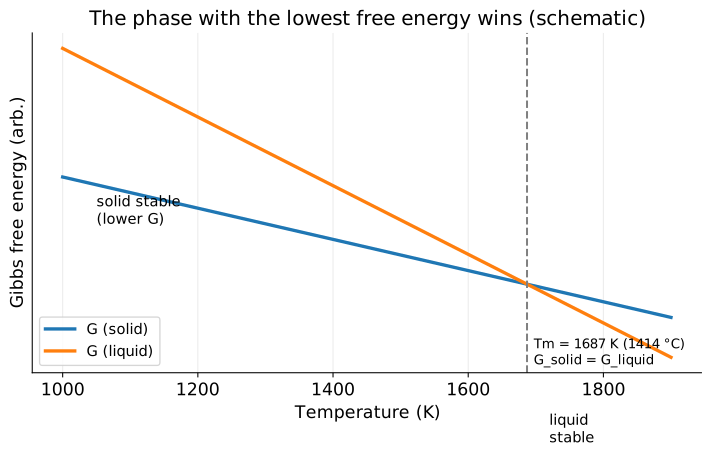
- Explain Gibbs free energy \(G = H - TS\) and why phases change at a melting point.
- Read a binary phase diagram: liquidus, solidus, eutectic, two-phase regions, lever rule.
- Explain the Al–Si eutectic and why it matters for cell contacts.
- Define the segregation coefficient and use the Scheil equation to predict concentration along an ingot.
- Explain why silicon's expansion on freezing matters.
Why this matters
Czochralski growth, directional solidification, zone refining, aluminium back-surface fields, silver-paste firing and solder joints are all phase-diagram problems. The resistivity spread along an ingot — a daily concern for wafer buyers — is the Scheil equation.
Free energy decides
The Gibbs free energy combines enthalpy \(H\) (bond energy; lower is better bonded) and entropy \(S\) (disorder; higher is favoured at high temperature):
In words: at low temperature, strong bonding (low H) wins — solids; at high temperature, disorder (high S) wins — liquids and gases. The melting point is where \(G_\text{solid} = G_\text{liquid}\). For silicon, \(T_m = 1414\) °C (1687 K).
Melting silicon needs its latent heat of fusion, about 50.2 kJ/mol (≈ 1.8 kJ/g; CRC Handbook), plus the heat to warm it from room temperature.
Worked example 1 — minimum energy to melt 1 kg of silicon
Warming 25 → 1414 °C with an average heat capacity of roughly 0.9 J g⁻¹ K⁻¹ (estimate over this range): \(1000 \times 0.9 \times 1389 \approx 1.25\) MJ. Melting: \(1000 \times 1.79 = 1.79\) MJ. Total ≈ 3.0 MJ ≈ 0.85 kWh — a thermodynamic minimum. Real Cz pullers use many times more because of radiation and conduction losses from the hot zone over a multi-day growth run (SOL 301).
Silicon expands on freezing (like water): liquid Si is denser (about 2.57 g/cm³ near the melting point vs 2.33 g/cm³ for the solid; literature values), so solidification increases volume by roughly 10 %. This stresses crucibles in casting and must be handled in crystal-growth design.
Reading a binary phase diagram
A binary phase diagram shows which phases exist at each temperature and composition for a two-element system at equilibrium. - Liquidus: above it, all liquid. - Solidus: below it, all solid. - Two-phase region: between them, liquid + solid coexist with compositions given by the ends of a horizontal tie line. - Eutectic point: the composition with the lowest melting point, where liquid freezes directly into two solids.
Lever rule (fractions in a two-phase region): with overall composition \(C_0\), liquid composition \(C_L\) and solid composition \(C_S\),
In words: the tie line is a see-saw balanced at \(C_0\); the phase on the far side gets the bigger share.
The Al–Si system: why aluminium paste alloys into silicon
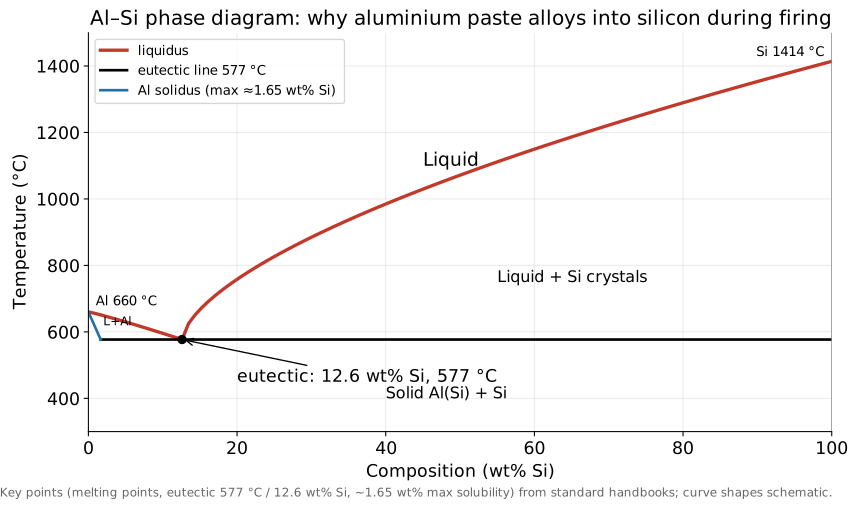
During firing of a PERC or Al-BSF cell (peak ~750–800 °C for seconds; estimate), the screen-printed aluminium melts and dissolves silicon (moving along the liquidus). On cooling, silicon regrows epitaxially from the melt carrying dissolved aluminium (a p-type dopant), forming a heavily doped p⁺ back-surface field, topped by the Al–Si eutectic. Because firing temperature exceeds 577 °C, Al and Si can react far below either element's melting point — the essence of a eutectic. Silver-paste contacts rely on similar chemistry with glass frit and the Ag–Si system (eutectic around 835 °C; handbook value).
Segregation during freezing
When an alloy or doped melt solidifies slowly, the solid that forms usually has a different impurity concentration than the liquid it grows from. The equilibrium segregation coefficient is
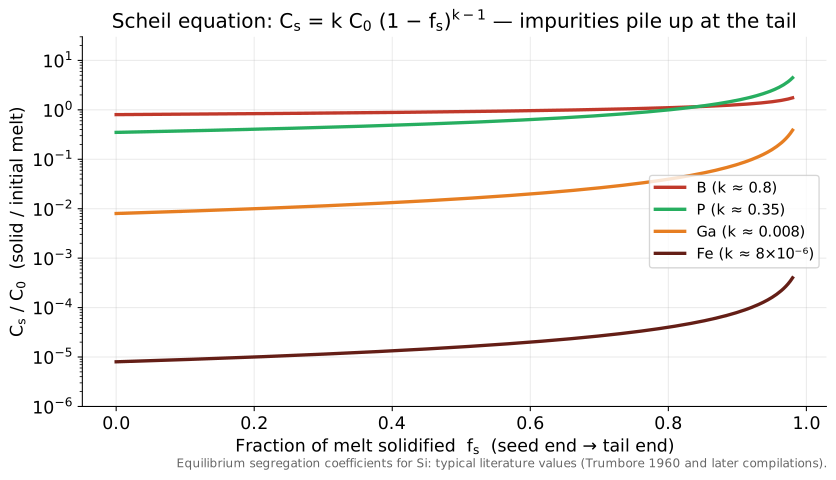
For most impurities in silicon \(k_0 \ll 1\): they are rejected into the liquid. Typical values (Trumbore 1960 and later compilations): B ≈ 0.8, P ≈ 0.35, As ≈ 0.3, Ga ≈ 0.008, Al ≈ 0.002, Cu ≈ 4 × 10⁻⁴, Fe ≈ 8 × 10⁻⁶. Oxygen is close to 1 (values debated).
The Scheil equation
Assume (1) no diffusion in the solid, (2) a perfectly mixed liquid, (3) local equilibrium at the interface. Then as fraction \(f_s\) of the original melt solidifies, the solid forming has concentration
In words: the first solid is cleaner than the melt by factor \(k_0\); as rejected impurity accumulates in the shrinking liquid, each new layer of solid gets dirtier; the last bit to freeze holds most of the impurities.
Worked example 2 — resistivity along an n-type ingot
Phosphorus, \(k_0 = 0.35\). At the seed end (\(f_s = 0\)): \(C_S = 0.35\,C_0\). At 80 % solidified: \(C_S = 0.35\,C_0 (0.2)^{-0.65} = 0.35\,C_0 \times 2.85\). Doping rises 2.85× → resistivity falls to about 1/2.85 of the seed-end value (mobility changes slightly). So an ingot that starts at 3 Ω·cm ends near 1 Ω·cm — a wide distribution that wafer and cell makers must manage (e.g., continuous Cz with melt replenishment, SOL 301).
Worked example 3 — why boron was convenient and gallium is hard
Boron (\(k_0 = 0.8\)): at \(f_s = 0.8\), \((0.2)^{-0.2} = 1.38\) → only 38 % increase. Gallium (\(k_0 = 0.008\)): \((0.2)^{-0.992} = 4.9\) → nearly 5× increase. That is the price p-type makers paid for switching from B to Ga to avoid B–O LID (Unit 5).
Worked example 4 — purification of iron
Iron \(k_0 = 8\times10^{-6}\): a melt with 10¹⁵ Fe/cm³ grows a seed-end crystal with \(8\times10^{9}\) cm⁻³ — a 125,000-fold purification in one step. Even at 90 % solidified, \((0.1)^{-1} \approx 10\) → \(8\times10^{10}\) cm⁻³. Tail ends ("tops and tails") are cut off and recycled carefully because they concentrate impurities.
Zone refining and directional solidification
Zone refining passes a molten zone repeatedly along a bar, sweeping impurities to one end each pass (the float-zone process uses a single RF-heated zone). Directional solidification of cast ingots purifies by the same Scheil physics; upgraded metallurgical-grade (UMG) silicon routes rely on it, with limits for B and P whose \(k_0\) is closer to 1.
Common misconceptions
Misconceptions
- "A eutectic is a special compound." It is a composition where liquid freezes into two solid phases at the lowest melting point.
- "Crystal growth only shapes silicon." It also purifies (k ≪ 1 for metals) and sets doping profiles.
- "Doping is uniform along an ingot." It follows Scheil: it increases toward the tail for k < 1.
- "Phase diagrams show what happens in fast processes." They show equilibrium; fast firing and quenching can trap non-equilibrium states.
What this means for manufacturing and the job
- Ingot resistivity specs and the choice of dopant (P for n-type, Ga for p-type) come from segregation (SOL 301).
- Firing profiles of Al and Ag pastes are phase-diagram engineering (SOL 302).
- Solder alloys (Sn–Pb, Sn–Bi, Sn–Ag–Cu) for interconnects are eutectic systems chosen for melting temperature (SOL 304).
- Crystal-growth roles at SpaceX/Tesla mention melt, thermal and segregation control — this is the foundation.
Key equations
| Equation | In words |
|---|---|
| \(G = H - TS\) | phase stability: bonding vs disorder |
| \(f_s = (C_0 - C_L)/(C_S - C_L)\) | lever rule |
| \(k_0 = C_S/C_L\) | segregation coefficient |
| \(C_S = k_0 C_0 (1-f_s)^{k_0-1}\) | Scheil: concentration along a directionally frozen ingot |
Review questions
1. At 700 °C, is an Al-rich alloy with 12.6 wt% Si solid or liquid?
Liquid — it is above the 577 °C eutectic temperature at the eutectic composition.
2. Phosphorus k₀ = 0.35. Ratio of dopant concentration at 50 % solidified to the seed end?
(1 − 0.5)^(0.35−1) = 0.5^(−0.65) = 1.57.
3. Why are ingot tails often scrapped or recycled carefully?
The last-to-freeze melt is enriched in impurities with k < 1 (metals, and excess dopant), giving poor lifetime and out-of-spec resistivity.
4. Using the lever rule: C₀ = 30 %, C_L = 20 %, C_S = 60 %. Fraction solid?
(30 − 20)/(60 − 20) = 0.25.
5. Why does silicon's expansion on freezing matter for casting?
The ~10 % volume increase stresses the crucible and the solidifying ingot; designs must allow for it to avoid cracking.
Sources
- Callister & Rethwisch, ch. 9 (phase diagrams); Porter & Easterling, Phase Transformations in Metals and Alloys (Scheil).
- Trumbore, Bell Syst. Tech. J. 39, 205 (1960) — segregation coefficients in Si and Ge.
- ASM Handbook Vol. 3 (Alloy Phase Diagrams) — Al–Si and Ag–Si key points.
- CRC Handbook — latent heat; liquid/solid Si densities from standard literature values.
- PVEducation, "Aluminium Back Surface Field" page.