Unit 7 — Diffusion and Kinetics: Fick's Laws and Temperature Dependence
Big idea. Atoms in a solid move by random hops. The net result is diffusion: flow from high to low concentration, described by Fick's laws. Diffusion distance grows as \(\sqrt{Dt}\), and the diffusion coefficient \(D\) rises exponentially with temperature (Arrhenius). This is how emitters are formed (phosphorus diffused ~0.3–0.5 µm into silicon at ~800–900 °C) and why metals, which diffuse millions of times faster than dopants, contaminate whole wafers in seconds at high temperature.
Learning objectives
- Explain diffusion as a random walk and derive \(\langle x^2\rangle \propto t\).
- State and interpret Fick's first and second laws.
- Use the erfc (constant source) and Gaussian (limited source) solutions.
- Apply the Arrhenius relation \(D = D_0 e^{-E_a/k_BT}\); extract \(E_a\) from data.
- Compare dopant and metal diffusion in silicon and connect to emitter formation and gettering.
Why this matters
Tube diffusion (POCl₃, BBr₃), firing, hydrogenation, gettering, oxidation and TOPCon poly-Si anneals are diffusion problems. Process engineers tune time and temperature to hit junction depth and sheet resistance; contamination engineers worry about metals because of their huge diffusivities.
Random walk
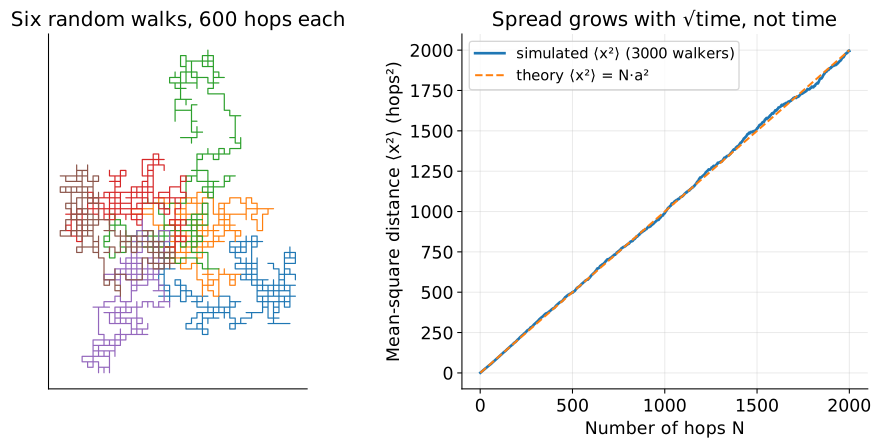
At high temperature each atom occasionally hops to a neighbouring site — into a vacancy, or between interstitial positions. Hops are random in direction. After \(N\) hops of length \(a\), the average displacement is zero, but the mean-square displacement grows linearly:
Fick's laws
First law — flux is proportional to the concentration gradient:
In words: atoms flow downhill in concentration, faster for steeper gradients and larger D. \(D\) (cm²/s) is the diffusion coefficient.
Second law — how concentration changes in time:
In words: concentration rises where the profile curves upward (a dip fills in) and falls where it curves downward (a peak spreads). The characteristic diffusion length is \(\sqrt{Dt}\) (some texts use \(2\sqrt{Dt}\)).
Two classic solutions
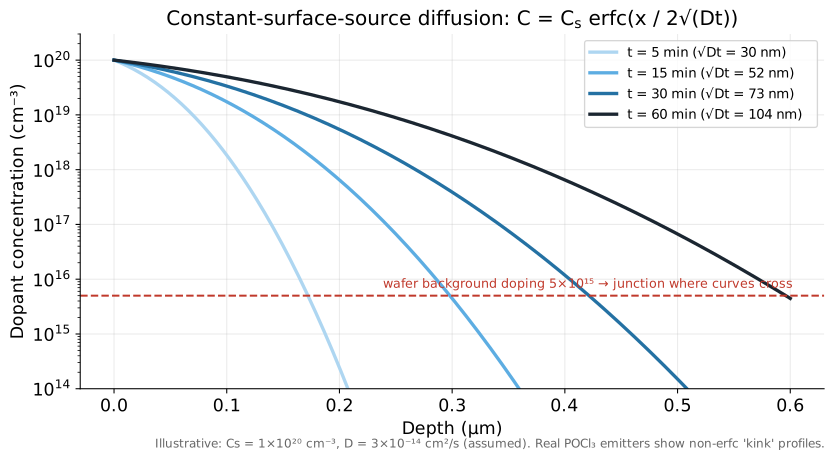
Constant surface concentration (the surface held at \(C_s\) by a gas source, like POCl₃ pre-deposition):
Limited source (a fixed dose \(Q\) per area driven in, no more supplied):
The junction depth \(x_j\) is where the diffused dopant concentration equals the wafer's background doping of the opposite type.
Temperature: the Arrhenius law
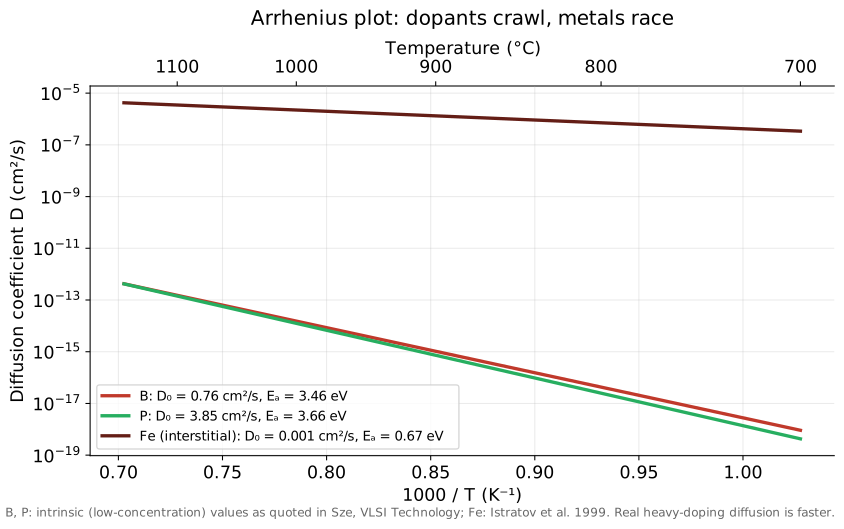
Hops need to overcome an energy barrier, so the hop rate — and \(D\) — follow
In words: every increase in temperature multiplies D by a large factor; the activation energy \(E_a\) sets how sensitive. Plot \(\ln D\) against \(1/T\): a straight line with slope \(-E_a/k_B\).
Worked example 1 — boron at 1000 °C
\(D = 0.76\exp\!\left(-\dfrac{3.46}{8.617\times10^{-5}\times1273}\right) = 1.5\times10^{-14}\) cm²/s. After 1 h: \(\sqrt{Dt} = \sqrt{1.5\times10^{-14}\times3600} = 7.4\times10^{-6}\) cm = 74 nm. Dopant diffusion is slow — microns take hours at ~1000 °C.
Worked example 2 — the intrinsic value underestimates real emitters
Phosphorus at 900 °C, intrinsic: \(D \approx 7\times10^{-16}\) cm²/s → after 30 min \(\sqrt{Dt} \approx 11\) nm. Yet industrial POCl₃ emitters reach junction depths of a few hundred nm in similar times. Why? At concentrations of 10²⁰ cm⁻³ and above, phosphorus diffuses via charged point defects much faster ("concentration-enhanced diffusion"), and the high-concentration region near the surface behaves differently (inactive P, the "kink"). Lesson: textbook intrinsic numbers are a starting point; real process models (and process engineers) calibrate to measured profiles (SOL 302).
Worked example 3 — iron races through a wafer
At 800 °C: \(D_\text{Fe} = 10^{-3}\exp(-0.67/(8.617\times10^{-5}\times1073)) = 7.1\times10^{-7}\) cm²/s. In just 60 s, \(\sqrt{Dt} = 65\) µm — half a wafer thickness. Even at 200 °C, \(D \approx 7\times10^{-11}\) cm²/s gives ~5 µm per hour. Metals picked up anywhere on a wafer spread everywhere during any thermal step — so cleanliness before furnaces is critical, and gettering layers can collect metals from the whole wafer.
Kinetics beyond diffusion
Chemical reaction rates follow the same Arrhenius form (\(k = A e^{-E_a/k_BT}\)). Rules of thumb you'll meet: thermal oxidation rates (Deal–Grove model: linear then parabolic growth, Unit 8), etch rates of KOH (strongly temperature-dependent — bath temperature is a tightly controlled parameter), and the "thermal budget" concept (time × temperature exposure) used to protect a-Si:H in HJT cells and to avoid oxygen precipitation in TOPCon wafers.
Common misconceptions
Misconceptions
- "Twice the time, twice the depth." Depth goes as \(\sqrt{t}\): four times the time for twice the depth.
- "A bit hotter is a bit faster." Arrhenius makes it exponential: for B near 1000 °C, +50 °C multiplies D by about 3.3 (review question 2).
- "Atoms only diffuse in liquids and gases." Solids diffuse too — slowly, but furnaces make it practical.
- "Dopant diffusion and contamination are separate problems." Same physics; metals just have much larger D.
What this means for manufacturing and the job
- Tube diffusion and anneal recipes (time, temperature, gas flows) set emitter sheet resistance and depth; engineers monitor them by four-point probe and ECV/SIMS profiles (SOL 302/401).
- Thermal-budget management distinguishes HJT (≤ ~200–250 °C) from TOPCon (high-temperature steps) lines (SOL 303).
- Contamination control and gettering are explicitly mentioned in postings (SOL 402).
Key equations
| Equation | In words |
|---|---|
| \(J = -D\,\partial C/\partial x\) | Fick I: flux down the gradient |
| \(\partial C/\partial t = D\,\partial^2 C/\partial x^2\) | Fick II: profiles spread |
| \(C = C_s\,\text{erfc}(x/2\sqrt{Dt})\) | constant-source profile |
| \(C = \frac{Q}{\sqrt{\pi Dt}}e^{-x^2/4Dt}\) | limited-source (drive-in) profile |
| \(D = D_0 e^{-E_a/k_BT}\) | Arrhenius temperature dependence |
Review questions
1. A diffusion gives 0.3 µm in 20 min. How long for 0.6 µm at the same temperature?
Depth ∝ √t → 4 × 20 = 80 min.
2. Compute D for boron at 1050 °C and compare to 1000 °C.
D = 0.76 exp(−3.46/(8.617×10⁻⁵ × 1323)) ≈ 5.0 × 10⁻¹⁴ cm²/s — about 3.3× the 1000 °C value.
3. Two measurements: D = 1 × 10⁻¹³ cm²/s at 1100 K and 1 × 10⁻¹¹ at 1250 K. Activation energy?
Eₐ = k ln(D₂/D₁)/(1/T₁ − 1/T₂) = 8.617×10⁻⁵ × ln(100)/(1/1100 − 1/1250) = 8.617×10⁻⁵ × 4.605/1.091×10⁻⁴ ≈ 3.64 eV.
4. Why can a fingerprint on a wafer before a furnace step ruin the whole wafer?
It deposits metals (Fe, Cu, Na...) that diffuse micrometres to tens of micrometres in seconds to minutes at furnace temperatures, spreading lifetime-killing defects throughout the wafer.
5. Which profile (erfc or Gaussian) describes a drive-in after the source is removed?
Gaussian (limited source).
Sources
- Plummer, Deal & Griffin, Silicon VLSI Technology, ch. 7 (diffusion); Sze (ed.), VLSI Technology (intrinsic D₀, Eₐ values used here).
- Istratov, Hieslmair & Weber, Appl. Phys. A 69, 13 (1999) — iron diffusivity.
- Crank, The Mathematics of Diffusion — erfc/Gaussian solutions.
- PVEducation, "Diffusion" (manufacturing section).